The AB Electronics UK Knowledge Base provides support solutions, tutorials and troubleshooting guides.

YOU WILL NEED THIS BOARD
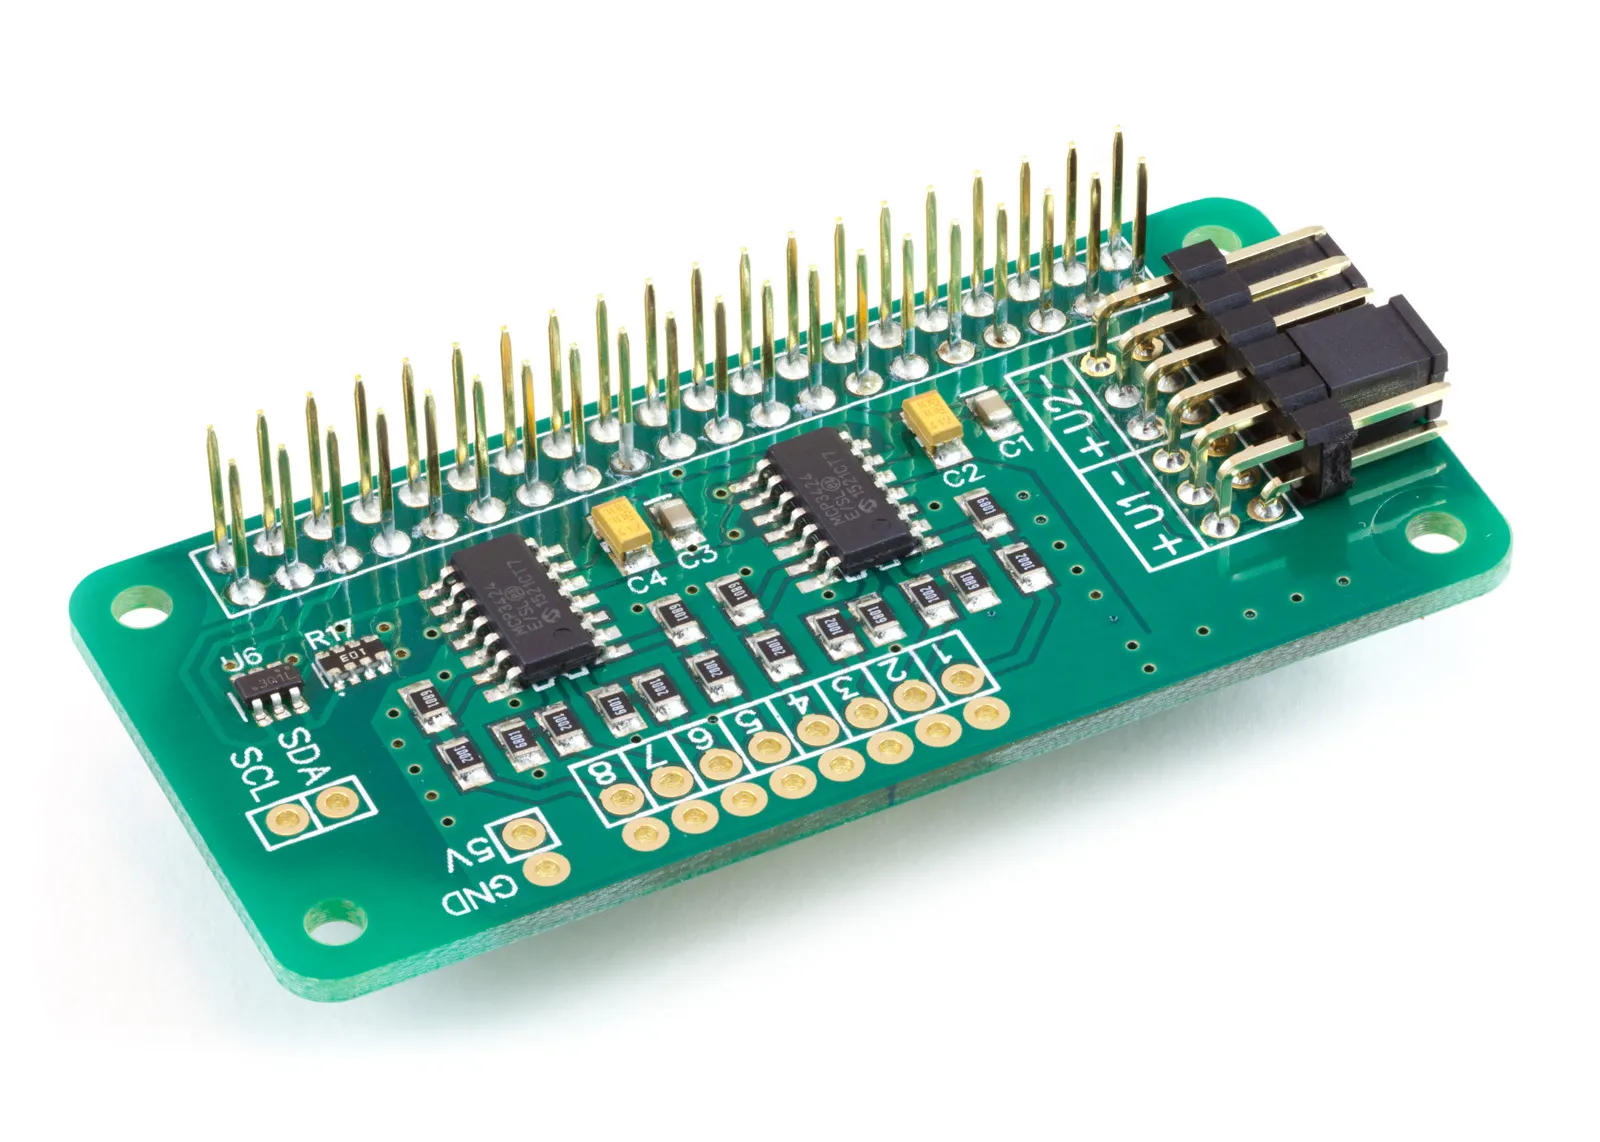
ADC Pi
8 Channel 17-bit Single-Ended Analogue to Digital Converter for the Raspberry Pi and Single-Board Computers
£16.19 ex VAT
In this tutorial, we will read the voltage on all eight channels of the ADC Pi and plot them live on a scrolling line chart, inside a window on the Raspberry Pi desktop. We will use tkinter to build the window and matplotlib to draw the chart, and the two will refresh several times a second as the voltages change.
You will need your Raspberry Pi running Raspberry Pi OS with the desktop, an ADC Pi, and one or more analogue signals to measure. A 1K potentiometer wired across the 3.3V and ground pins is an easy way to produce a voltage you can vary by hand while you watch the chart respond.
Because the program opens a window, you must run it on the Raspberry Pi desktop itself, or over VNC or a remote desktop. It will not work from a plain SSH session with no display attached.
We will use the AB Electronics Python library to talk to the ADC Pi. To download the library, visit our Python Library and Demos knowledge base article.
You must enable i2c on your Raspberry Pi; see our other tutorial on i2c: I2C, SMBus and Raspbian Linux.
The AB Electronics Python library uses another library called python3-smbus. This tutorial also needs tkinter and matplotlib to draw the window and the chart. On Raspberry Pi OS you can install all three with apt using the following commands.
sudo apt update
sudo apt install python3-smbus python3-tk python3-matplotlib
tkinter and matplotlib are often already present on a full Raspberry Pi OS desktop install, but running the command above does no harm and makes sure they are there.
With the libraries installed and the Raspberry Pi configured to use i2c, we can begin building the project.
Stage 1 - Connecting the ADC Pi
If you haven't done so, install your ADC Pi onto the Raspberry Pi by connecting it to the GPIO header. Make sure your Raspberry Pi is turned off when you do this to minimise the risk of damaging the Raspberry Pi or the ADC Pi.
The ADC Pi carries two Microchip MCP3424 analogue-to-digital converter chips, each handling four of the eight inputs. The two chips sit on separate I2C addresses so the Raspberry Pi can read them independently. With the address jumpers in their default positions, channels 1–4 are on address 0x68 and channels 5–8 are on 0x69. If you have changed the jumpers, see the address table on the ADC Pi product page and adjust the two addresses in the code to match.
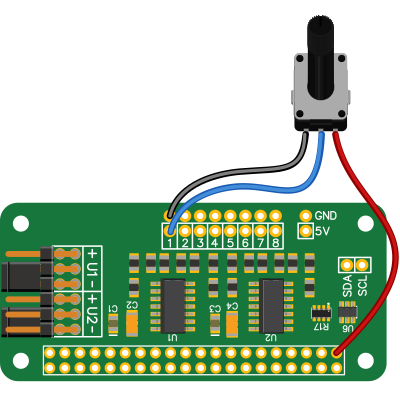
Connect whatever you want to measure to the input channels, keeping each input between 0V and 5.06V. The library returns the voltage already scaled to that range, so there is nothing to convert in your own code.
We will start by creating a new Python program file called demo_gui.py for this tutorial. You can use your favourite text editor to write the program. You can find a complete copy of demo_gui.py in the ABElectronics_Python_Libraries/ADCPi/demos/ folder.
Stage 2 - Importing the libraries and setting up the ADC
At the top of the file we import the standard library modules we need, then matplotlib, then the ADCPi library.
import sys
import collections
import tkinter as tk
sys lets us adjust the import path later if the ADCPi library isn't installed system-wide. collections gives us the deque we will use to store recent readings. tkinter is Python's built-in GUI toolkit, and we import it as tk to save typing.
try:
    import matplotlib
    matplotlib.use("TkAgg")
    from matplotlib.figure import Figure
    from matplotlib.backends.backend_tkagg import FigureCanvasTkAgg
    from matplotlib.animation import FuncAnimation
except ImportError:
    raise ImportError("matplotlib is required: pip install matplotlib")
The line matplotlib.use("TkAgg") tells matplotlib to draw using the Tk backend, so its output can be placed inside our tkinter window. Figure is the drawing surface, FigureCanvasTkAgg is the bridge that turns a matplotlib figure into a tkinter widget, and FuncAnimation is the helper that will call our update function over and over to keep the chart moving. Wrapping the imports in a try/except means that if matplotlib is missing, the program stops with a clear message rather than a confusing error further down.
try:
    from ADCPi import ADCPi
except ImportError:
    print("Failed to import ADCPi from python system path")
    print("Importing from parent folder instead")
    try:
        sys.path.append('..')
        from ADCPi import ADCPi
    except ImportError:
        raise ImportError("Failed to import library from parent folder")
This imports the ADCPi class. If the library isn't installed on the system path, it falls back to looking in the parent folder, which is where ADCPi.py sits relative to the demos folder. That way the program runs whether or not you have installed the library globally.
Next we set two constants that control how the chart behaves.
HISTORY_LENGTH = 100
UPDATE_INTERVAL_MS = 200
HISTORY_LENGTH is how many past readings each line shows, so 100 points scrolling across the chart.
UPDATE_INTERVAL_MS is how often we take a fresh set of readings and redraw, here every 200 milliseconds, or five times a second. Pulling these out as named constants at the top makes them easy to change without hunting through the code.
A Quick Note on the update interval and sample rates:
The update interval time needs to be long enough to sample all eight channels on the ADC Pi.
The MCP3424 can convert at four resolutions, and the resolution you choose sets how long each conversion takes. The higher the resolution, the longer the chip needs to produce a reading.
| Library bit setting | Conversion rate | Time per conversion |
|---|---|---|
| 12 | 240 samples/sec | ~4 ms |
| 14 | 60 samples/sec | ~17 ms |
| 16 | 15 samples/sec | ~67 ms |
| 18 | 3.75 samples/sec | ~267 ms |
With a 200 millisecond update interval that will leave 25 millseconds to sample each channel. This rules out using 16 or 18 bit modes as they would take too long to sample all of the channels. 14 bits would sample in in 17ms per channel but that would not leave a lot of time for the Raspberry Pi to update the display. Using 12 bit mode will allow enough time to read all 8 channels and animate the chart smoothly so for this tutorial we will use 12 bit mode.
Because the ADC Pi is wired as a single-ended converter, the usable resolution is one bit below the mode number, so 12-bit mode gives an effective 11-bit reading, or about 2.5mV per step across the 0–5.06V range. That is ample for watching voltages move on a chart.
If you want to sample at a higher resolution you can increase the update interval or reduce the number of channels being sampled.
Next we then define a colour for each of the eight channels so every line is easy to tell apart.
CHANNEL_COLOURS = [
    "#e6194b",
    "#3cb44b",
    "#4363d8",
    "#f58231",
    "#911eb4",
    "#42d4f4",
    "#f032e6",
    "#bfef45",
]
Each entry is a hex colour string of the form "#RRGGBB". We will use the same colour for a channel's line on the chart and for its value label at the bottom of the window, so the two always match.
All of the working parts of the program live inside a class called ADCChartApp. Grouping them this way keeps the chart, the readings and the ADC together, so the update function can reach all of them without passing everything around by hand.
class ADCChartApp:

    def __init__(self, root):
        self.root = root
        self.root.title("ADC Pi - 8 Channel Voltage Monitor")
        self.root.protocol("WM_DELETE_WINDOW", self._on_close)
The init method runs once, when we create the application. root is the main tkinter window. We store it so the other methods can use it, set the text in its title bar, and tell tkinter to call our _on_close method when the user clicks the window's close button. We will use that later to shut the animation down cleanly.
self.adc = ADCPi(0x68, 0x69, 12)
This creates the ADCPi object we will read from. The first two values are the I2C addresses of the two MCP3424 chips, 0x68 and 0x69, matching the default jumper settings. The third value, 12, sets the bit rate.
        self.history = [
            collections.deque([0.0] * HISTORY_LENGTH, maxlen=HISTORY_LENGTH)
            for _ in range(8)
        ]
This builds the store for our readings: a list of eight deques, or double ended queues, one per channel. A deque with maxlen set is a fixed-length queue. Once it holds HISTORY_LENGTH values, adding a new one to the right automatically drops the oldest off the left, which is exactly the behaviour we want for a scrolling chart. Each deque starts filled with 100 zeros so there is something to draw before any readings arrive.
        self._build_ui()

        self.ani = FuncAnimation(
            self.fig,
            self._update,
            interval=UPDATE_INTERVAL_MS,
            blit=False,
            cache_frame_data=False,
        )
Finally init calls _build_ui to create the chart and labels, which we will come to next, then starts a FuncAnimation. FuncAnimation repeatedly calls our _update method every UPDATE_INTERVAL_MS milliseconds, and _update is where we read the ADC and refresh the display. Setting blit=False tells it to redraw the whole chart each frame, which is simpler and fast enough here, and cache_frame_data=False stops it storing old frames in memory, since we never rewind.
Stage 3 - Building the chart with matplotlib
The _build_ui method creates everything you see: the chart and, below it, a row of live voltage labels. We will take it in pieces.
First we create the matplotlib Figure and the Axes inside it.
    def _build_ui(self):
        self.fig = Figure(figsize=(10, 6), dpi=100, facecolor="#1e1e1e")
        self.ax = self.fig.add_subplot(111)
The Figure is the overall drawing surface; figsize is its size and facecolor sets a dark grey background. add_subplot(111) means "one row, one column, first subplot", in other words a single chart filling the figure. The Axes it returns, self.ax, is the actual plotting area where the lines, grid and labels go.
        self.ax.set_facecolor("#2b2b2b")
        self.ax.set_ylim(-0.1, 5.5)
        self.ax.set_xlim(0, HISTORY_LENGTH - 1)
        self.ax.set_title("ADC Pi Voltage Channels", color="white", fontsize=13)
        self.ax.set_xlabel("Samples", color="white")
        self.ax.set_ylabel("Voltage (V)", color="white")
        self.ax.tick_params(colors="white")
These lines style the chart. set_ylim fixes the vertical range from -0.1 to 5.5 volts, so it comfortably covers the ADC Pi's 0–5.06V input range and doesn't rescale itself as readings change. set_xlim fixes the horizontal range to the 100 samples we keep. The rest set the title, the axis labels and the tick colours to white so they stand out against the dark background.
        for spine in self.ax.spines.values():
            spine.set_edgecolor("#555555")

        self.ax.grid(color="#444444", linestyle="--", linewidth=0.5)
        self.fig.tight_layout(pad=2)
The spines are the four border lines around the plotting area; we colour them grey to suit the dark theme. grid adds a faint dashed grid to make values easier to read off, and tight_layout adds a little padding so nothing is clipped at the edges.
Now we draw the eight lines, one per channel.
        x = list(range(HISTORY_LENGTH))

        self.lines = []

        for i in range(8):
            (line,) = self.ax.plot(
                x,
                list(self.history[i]),
                color=CHANNEL_COLOURS[i],
                linewidth=1.5,
                label=f"Ch {i + 1}",
            )
            self.lines.append(line)
x is simply the sample numbers 0 to 99 along the bottom; these never change, only the voltages plotted against them do. For each channel we call ax.plot to draw a line, using that channel's colour from our list and labelling it "Ch 1" through to "Ch 8". ax.plot returns a list containing one line object, and the comma in (line,) unpacks that single item straight into the line variable. We keep every line in self.lines so that later we can update its data without redrawing the whole chart from scratch.
The label on each line feeds the legend, which we add next.
        self.ax.legend(
            loc="upper right",
            fontsize=8,
            facecolor="#333333",
            edgecolor="#555555",
            labelcolor="white",
        )
This draws the legend in the top right corner, mapping each colour to its channel name and styled to match the dark chart.
Stage 4 - Placing the chart in a tkinter window
With the chart built, we can put it into the tkinter window.
        canvas = FigureCanvasTkAgg(self.fig, master=self.root)
        canvas.draw()  # render the initial (all-zeros) chart
        canvas.get_tk_widget().pack(side=tk.TOP, fill=tk.BOTH, expand=True)
        self.canvas = canvas
FigureCanvasTkAgg wraps the matplotlib figure so tkinter can treat it as one of its own widgets. canvas.draw() renders the initial, all-zeros chart. pack is tkinter's simplest layout manager: side=tk.TOP places the chart at the top of the window, and fill=tk.BOTH with expand=True lets it grow and shrink as the window is resized.
Below the chart we build a row of labels, one per channel, showing each voltage as a number.
        label_frame = tk.Frame(self.root, bg="#1e1e1e")
        label_frame.pack(side=tk.BOTTOM, fill=tk.X, padx=4, pady=4)
        self.value_labels = []
A Frame is an invisible container used to group and position other widgets. This one sits along the bottom of the window and will hold the eight channel labels. self.value_labels will collect the labels whose text we update each frame.
        for i in range(8):
            frame = tk.Frame(label_frame, bg="#2b2b2b", bd=1, relief=tk.SUNKEN)
            frame.pack(side=tk.LEFT, expand=True, fill=tk.X, padx=2)

            tk.Label(
                frame,
                text=f"Ch {i + 1}",
                bg="#2b2b2b",
                fg=CHANNEL_COLOURS[i],
                font=("Helvetica", 9, "bold"),
            ).pack()

            lbl = tk.Label(
                frame,
                text="0.000 V",
                bg="#2b2b2b",
                fg="white",
                font=("Helvetica", 9),
            )
            lbl.pack()
            self.value_labels.append(lbl)
For each channel we make a small sunken frame that looks like a little card, and place them side by side across the bottom. Inside each card are two labels: a fixed one naming the channel, coloured to match its line on the chart, and a second showing the voltage. That second label starts at "0.000 V" and is the one we change as readings come in, so we keep a reference to it in self.value_labels.
Stage 5 - Reading the voltages and updating the chart
The _update method is the heart of the program. FuncAnimation calls it automatically every 200 milliseconds, and each time it reads all eight channels and refreshes the display.
    def _update(self, _frame):
        for i in range(8):
            voltage = self.adc.read_voltage(i + 1)
            self.history[i].append(voltage)
            self.lines[i].set_ydata(list(self.history[i]))
            self.value_labels[i].config(text=f"{voltage:.3f} V")

        return self.lines # Return the list of lines
We loop over the eight channels. read_voltage does the actual measurement: we pass it the channel number, 1 to 8, and it returns the voltage on that input already scaled to the 0–5.06V range, so there is no conversion for us to do. The channels are numbered from 1, so channel 1 is i + 1 when i is 0.
For each reading we do three things. We append it to that channel's deque, which pushes the oldest value off the far end and shifts everything along. We hand the updated list of values to the line with set_ydata, which moves the line to match. And we update the channel's text label to the new voltage, formatted to three decimal places. Returning self.lines tells the animation which parts of the chart changed.
The last method handles closing the window.
    def _on_close(self):
        self.ani.event_source.stop()
        self.root.destroy()
When you click the window's close button, tkinter calls _on_close. We stop the animation first, so it isn't still trying to draw into a window that is being torn down, then destroy the window. Without this you can get a stream of errors as the program shuts down.
Finally, a short main function creates the window and starts everything running.
def main():
    root = tk.Tk()
    app = ADCChartApp(root)  # noqa: F841
    root.mainloop()

if __name__ == "__main__":
    main()
tk.Tk() creates the top-level window. We then create our ADCChartApp, which builds all the widgets and starts the animation, and call root.mainloop(), which hands control to tkinter and keeps the window open and responsive until you close it.
The complete program
Putting it all together, here is the finished demo_gui.py.
#!/usr/bin/env python

import sys
import collections
import tkinter as tk

try:
    import matplotlib
    matplotlib.use("TkAgg")
    from matplotlib.figure import Figure
    from matplotlib.backends.backend_tkagg import FigureCanvasTkAgg
    from matplotlib.animation import FuncAnimation
except ImportError:
    raise ImportError("matplotlib is required: pip install matplotlib")

try:
    from ADCPi import ADCPi
except ImportError:
    print("Failed to import ADCPi from python system path")
    print("Importing from parent folder instead")
    try:
        sys.path.append('..')
        from ADCPi import ADCPi
    except ImportError:
        raise ImportError("Failed to import library from parent folder")


HISTORY_LENGTH = 100
UPDATE_INTERVAL_MS = 200

CHANNEL_COLOURS = [
    "#e6194b",  # Ch 1 – red
    "#3cb44b",  # Ch 2 – green
    "#4363d8",  # Ch 3 – blue
    "#f58231",  # Ch 4 – orange
    "#911eb4",  # Ch 5 – purple
    "#42d4f4",  # Ch 6 – cyan
    "#f032e6",  # Ch 7 – magenta
    "#bfef45",  # Ch 8 – lime
]

class ADCChartApp:

    def __init__(self, root):
        self.root = root
        self.root.title("ADC Pi - 8 Channel Voltage Monitor")
        self.root.protocol("WM_DELETE_WINDOW", self._on_close)

        self.adc = ADCPi(0x68, 0x69, 12)

        self.history = [
            collections.deque([0.0] * HISTORY_LENGTH, maxlen=HISTORY_LENGTH)
            for _ in range(8)
        ]

        self._build_ui()

        self.ani = FuncAnimation(
            self.fig,
            self._update,
            interval=UPDATE_INTERVAL_MS,
            blit=False,
            cache_frame_data=False,
        )

    def _build_ui(self):
        self.fig = Figure(figsize=(10, 6), dpi=100, facecolor="#1e1e1e")
        self.ax = self.fig.add_subplot(111)

        self.ax.set_facecolor("#2b2b2b")
        self.ax.set_ylim(-0.1, 5.5)
        self.ax.set_xlim(0, HISTORY_LENGTH - 1)
        self.ax.set_title("ADC Pi Voltage Channels", color="white", fontsize=13)
        self.ax.set_xlabel("Samples", color="white")
        self.ax.set_ylabel("Voltage (V)", color="white")
        self.ax.tick_params(colors="white")

        for spine in self.ax.spines.values():
            spine.set_edgecolor("#555555")

        self.ax.grid(color="#444444", linestyle="--", linewidth=0.5)
        self.fig.tight_layout(pad=2)

        x = list(range(HISTORY_LENGTH))
        self.lines = []

        for i in range(8):
            (line,) = self.ax.plot(
                x,
                list(self.history[i]),
                color=CHANNEL_COLOURS[i],
                linewidth=1.5,
                label=f"Ch {i + 1}",
            )
            self.lines.append(line)

        self.ax.legend(
            loc="upper right",
            fontsize=8,
            facecolor="#333333",
            edgecolor="#555555",
            labelcolor="white",
        )

        canvas = FigureCanvasTkAgg(self.fig, master=self.root)
        canvas.draw()  # render the initial (all-zeros) chart
        canvas.get_tk_widget().pack(side=tk.TOP, fill=tk.BOTH, expand=True)
        self.canvas = canvas

        label_frame = tk.Frame(self.root, bg="#1e1e1e")
        label_frame.pack(side=tk.BOTTOM, fill=tk.X, padx=4, pady=4)

        self.value_labels = []

        for i in range(8):
            frame = tk.Frame(label_frame, bg="#2b2b2b", bd=1, relief=tk.SUNKEN)
            frame.pack(side=tk.LEFT, expand=True, fill=tk.X, padx=2)

            tk.Label(
                frame,
                text=f"Ch {i + 1}",
                bg="#2b2b2b",
                fg=CHANNEL_COLOURS[i],
                font=("Helvetica", 9, "bold"),
            ).pack()

            lbl = tk.Label(
                frame,
                text="0.000 V",
                bg="#2b2b2b",
                fg="white",
                font=("Helvetica", 9),
            )
            lbl.pack()
            self.value_labels.append(lbl)

    def _update(self, _frame):
        for i in range(8):
            voltage = self.adc.read_voltage(i + 1)
            self.history[i].append(voltage)
            self.lines[i].set_ydata(list(self.history[i]))
            self.value_labels[i].config(text=f"{voltage:.3f} V")

        return self.lines # Return the list of lines

    def _on_close(self):
        self.ani.event_source.stop()
        self.root.destroy()


def main():

    root = tk.Tk()
    app = ADCChartApp(root)  # noqa: F841
    root.mainloop()

if __name__ == "__main__":
    main()
Save your program and run it in a command terminal on the Raspberry Pi desktop using
python3 demo_gui.py
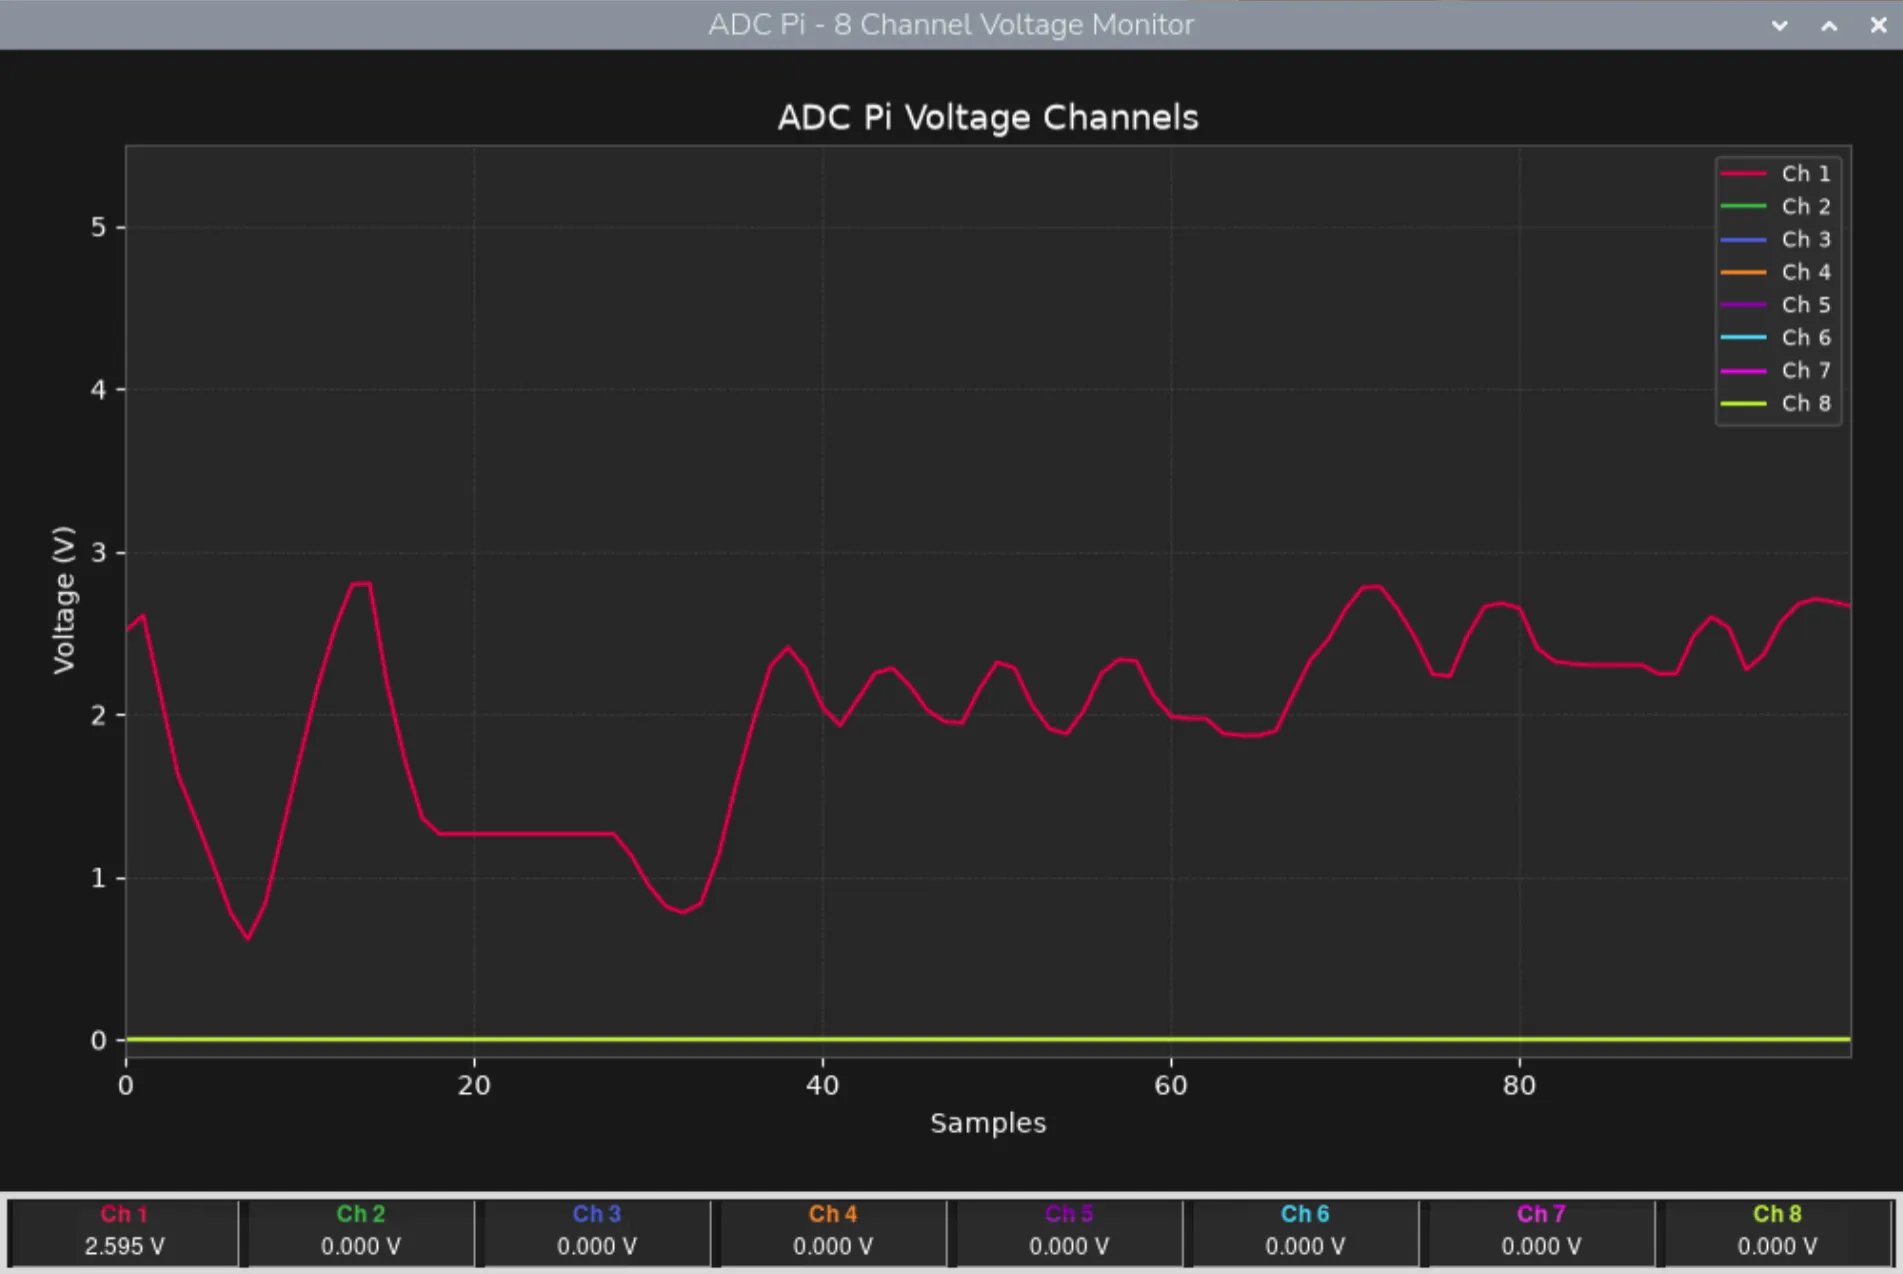
If everything goes as planned, a window will open showing eight coloured lines scrolling from right to left, with the live voltage for each channel listed along the bottom. Turn a potentiometer, or change a connected sensor's output, and you will see the matching line move in step.
To stop the program, close the window.
From here you can adapt the demo to suit your own project. Lengthening HISTORY_LENGTH shows a longer stretch of history; raising UPDATE_INTERVAL_MS slows the refresh to lighten the load on the Raspberry Pi; and switching the ADC to a higher bit rate such as 16 or 18 trades speed for resolution when you care more about accuracy than a fast-moving display.
Also useful for your Raspberry Pi project
Temperature & Sensing
1 Wire Pi Plus
Connect dozens of 1-Wire sensors - temperature, iButtons, EEPROMs - via a single GPIO pin. Stacks directly on the 40-pin header.
Analogue I/O
ADC Pi
Read up to 8 analogue inputs - perfect for pairing with your temperature sensors or other analogue-output devices.
All-in-one
Expander Pi
Combines ADC, DAC, 32 GPIO ports and a real-time clock on one board. The most versatile board for complex Raspberry Pi projects.
